

What is Proportionality, Anyway?
Part I of “How Votes Become Seats,” a Third Draft series on gerrymandering, geography, and representation.

A growing number of reformers argue the House of Representatives should move toward proportional representation. More than 200 political scientists signed an open letter calling on Congress to replace single-member districts with multi-member proportional districts.1
FairVote, Protect Democracy, and other reform organizations make the intuitive case—seats should track votes. If a party wins 35 percent of the vote, it should receive 35 percent of the seats.
That argument made me curious about the current system. How disproportional are single-member House elections? Are they more or less proportional than they used to be? I decided to chart the relationship between votes and seats over time.
I made the chart below: the Democratic share of the national vote for House of Representatives vs the Democratic proportion of House seats. When the dotted line is above the solid line, Democrats secured a higher proportion of seats than their share of the national vote.
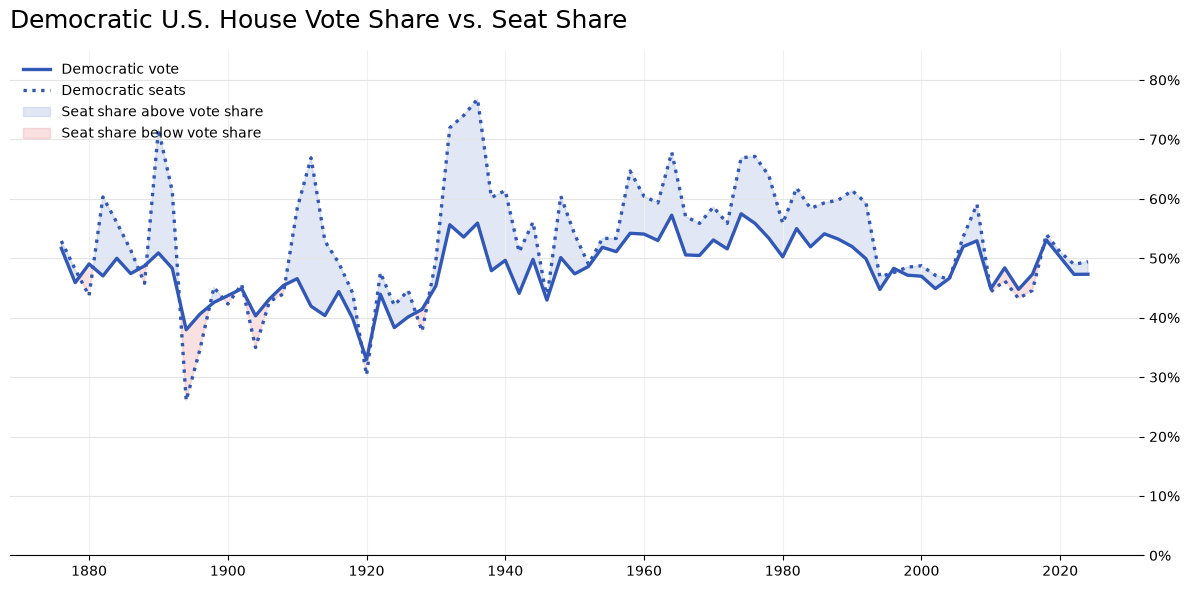
For instance, in 1892, Democrats secured 48% of the vote and 61% of House seats. Two years later, the Democratic share of the national vote decreased by 10 percentage points—to 38%—but their share of House seats halved, to 26%.
Excited, I sent the chart to a friend. House elections look more proportional in recent years than ever before, I said.
It’s a cool chart, he responded. But I don’t know how to discern proportionality from it.
Just look at the shading, Jack!
But the closer I looked, the more I had to agree:
The closer the vote share to 50%, the more material any seat surplus/deficit.
The “vote-seat gap” flattens two distinct concepts—bias and responsiveness—into one.
Measuring bias is hard, interpreting it is harder.
A seat surplus is more valuable today than it used to be.
The first point is easy to see. There may be a greater political difference 51 and 55 percent of seats than between 55 and 70 percent of seats.
More clearly, there is a discontinuity at 50%. A tiny seat surplus makes all the difference to a party that earns 49% of the vote.
From 1959 through 1994, Democrats always had at least 50 more House seats than Republicans. Today thin majorities are the norm. The world of landslides and durable majorities has given way to narrow margins and regular changes in control.2
That makes any seat surplus far more valuable.
Proportionality doesn’t tell us what we want to know.
Let’s say Democrats win 55% of votes and 65% of seats. That’s a 10pp seat surplus.
Is that fair? Maybe. If Republicans won 55% of the vote, would they have also won 65% of seats?
More generally: conditional on a vote share, would each party receive the same seat share?
Responsiveness is the percent change in seats corresponding to an additional percent of votes. Bias is an asymmetry between parties in the seat-vote relationship.
Consider three different ways of translating votes to seats:
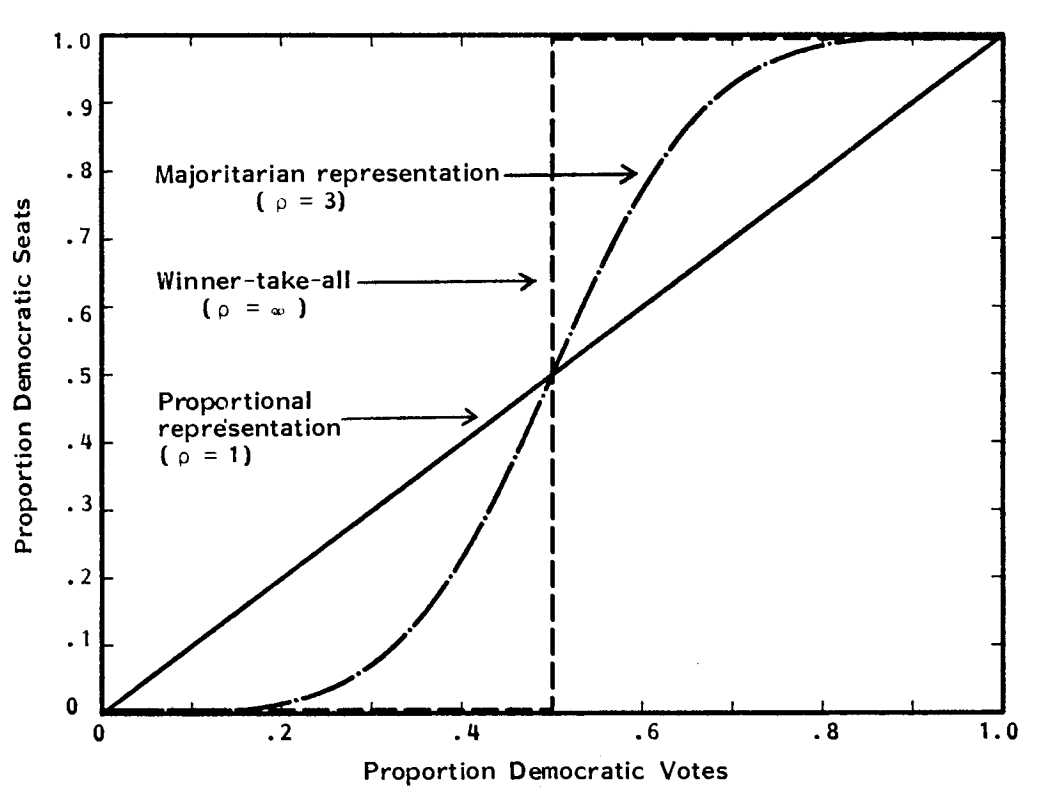
In a proportional system, 40% of votes secures the same share of seats. In a winner-take-all system it secures no seats. In the majoritarian system modeled here, it secures 30%.
The three systems are significantly different, but none of them are biased. Republicans and Democrats are treated the same.
Here are the winner-take-all and majoritarian system, with a bias:
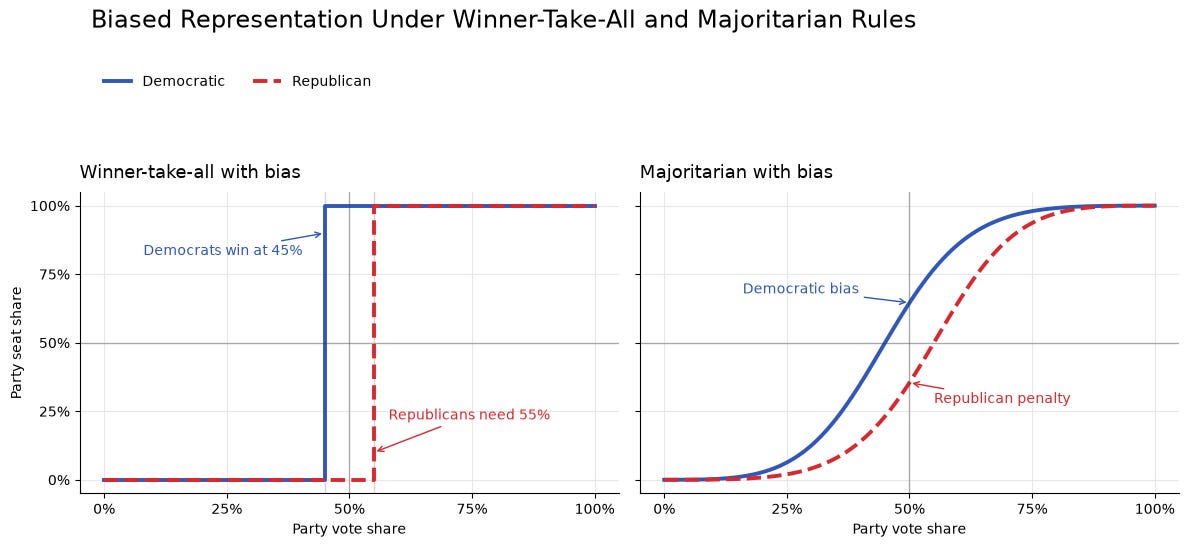
Now Republicans need more votes to achieve the same representation as Democrats.
Measuring bias is hard, interpreting it is harder.
Bias varies with vote share. Look again at the biased majoritarian system. The Republican penalty depends on the vote share. If Republicans win 100% of the vote, they win all of the seats; there is no bias. At other vote shares, there is a bias.
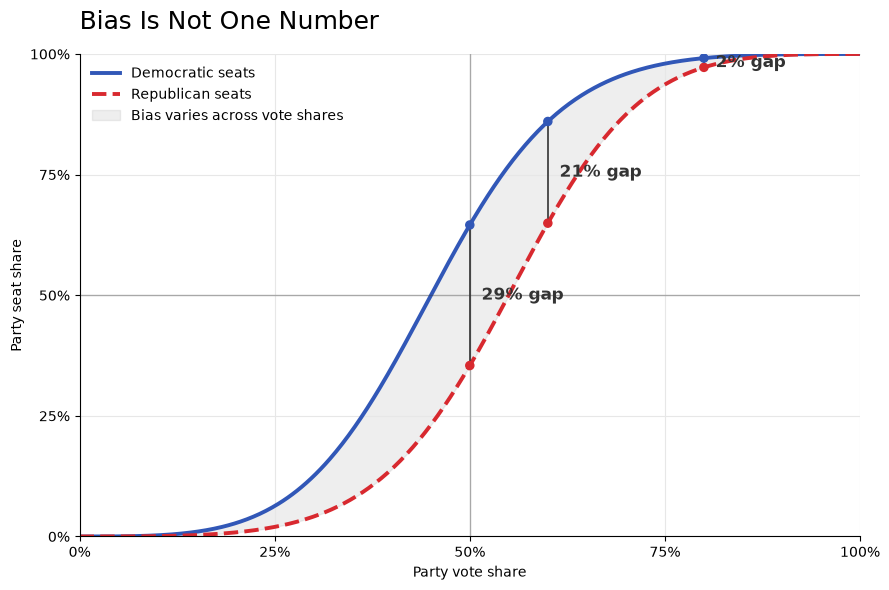
So where, along the curve, should we measure bias? Most commonly, political scientists measure bias when vote share = 0.5. They define “bias” as the difference between the seats Ds and Rs would expect to secure, if each with 50% of the vote. Others sum the difference in expected seats across several possible vote shares (e.g., if each party has 45%, 46%, etc., up to 55% of the vote). The more complete approach would be to sum the entire area between the curves, although that might put too much weight on unrealistic outcomes.
Additionally, elections do not magically produce vote-seat curves. An election delivers only one point along the curve. To recover the curve, political scientists model counterfactual elections. The simplest model, “uniform swing”, moves every district by the same amount (say, increase Democratic and decrease Republican vote share by 1% in each district), counts new seat shares, and traces the curve. Newer methods soften that assumption, allowing districts to vary around the swing.
Finally—and most critically—a good measure of bias does not uncover intention. Gerrymandering can create bias, but so can different turnout across districts and natural geographic sorting. Sorting is particularly salient today, as Democrats have become an overwhelmingly urban party.
Look again at the first chart. It tells us that seats are not perfectly proportional to votes. At times, seat share dramatically departs from vote share, although the largest gap is not necessarily most important. But the chart does not tell us whether there is a partisan bias, whether Democrats and Republicans would be treated equally if they achieved the same vote share.
This complicates my analysis of the proportionality of the House. More importantly, it complicates the argument for proportional representation.
There’s nothing wrong with saying that 35% of the vote should translate to 35% of seats. But the claim is broader than it first appears. It rejects partisan bias, which I suspect most people would agree with. It also rejects the winner’s bonus. In other words, it says the system should be less responsive—a 1% change in votes should yield a 1% change in representation.
That’s more controversial, and it’s a topic for another time.
https://protectdemocracy.org/work/democracy-scholars-end-single-member-districts/
https://www.theatlantic.com/ideas/archive/2022/11/us-elections-tight-race-democrat-republican-partisanship/672022/